From 14.6× to 6.3×: How a Marketing-Mix Model Re-Prices What Last-Click Gets Wrong
Most "marketing analytics" demos start with a platform export and end with a ROAS number. This one starts earlier and ends later — earlier, because the data is simulated from a known cause-and-effect model rather than downloaded, so last-click attribution is provably wrong instead of just arguably wrong; and later, because the goal isn't a ROAS number, it's a decision: which channels actually create demand, what they're worth in profit, and where the next pound should go.
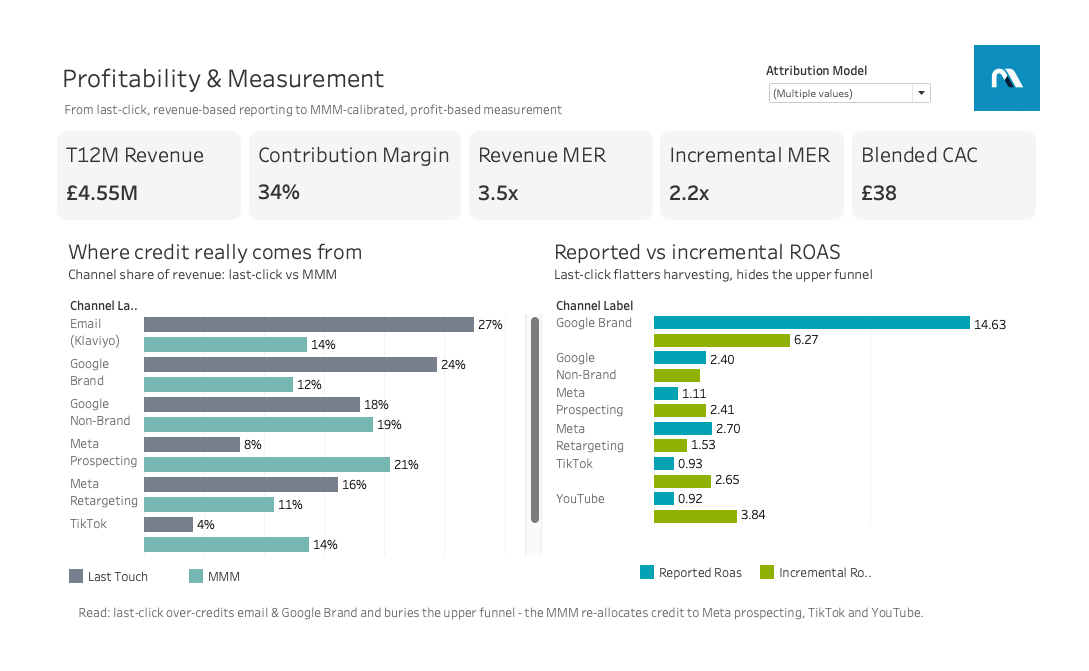
The worked example is Aurelia, a fictional UK D2C fashion brand doing ~£4.8m in trailing-12-month revenue across Shopify, Meta, Google, TikTok, Klaviyo and GA4. The headline it exists to demonstrate is a single channel: Google Brand search reports a 14.6× return on last-click, and the marketing-mix model prices it at 6.3× incrementally. Most of that "return" was harvesting demand that would have converted anyway.
This post walks the whole chain. First, how the data is generated so that last-click and true incrementality disagree by construction. Then how six fragmented sources are centralised into one modelled, profit-aware layer. And finally, how a Bayesian MMM recovers the real channel contributions — validated against the ground truth the simulation planted. No number here is asserted; each one is derived, and I'll show the derivation.
Part 1 — Simulating a brand that behaves like a real one
The temptation with synthetic marketing data is to generate each table independently: random orders here, random ad spend there, random touchpoints stitched on top. That produces tables that look plausible in isolation but encode no real cause and effect — so any attribution you compute on them is just re-describing your own random number generator.
So instead of generating tables, I generated a data-generating process and let the tables fall out of it. Daily revenue is modelled as a baseline plus the effect of each channel's spend:
revenue(t) = baseline(t) + Σ_channel coef · Hill( Adstock(spend_ch) )
Two transformations do the work, and they're the two that last-click ignores:
- Adstock (carryover). A TikTok view today still nudges a purchase next week. Each channel gets a geometric adstock, so today's spend decays into future days rather than vanishing at midnight.
- Hill saturation (diminishing returns). The tenth thousand pounds into a channel works less hard than the first. Each channel's response bends over as spend rises.
The story is seeded in how those parameters differ by channel. Upper-funnel channels — Meta prospecting, TikTok, YouTube — get high adstock and strong assist behaviour but rarely take the final click. Demand-harvesting channels — Google Brand, retargeting, email to existing customers — get low adstock, heavy last-click credit, and modest incremental effect. That single design choice is what makes last-click and incrementality disagree: the harvesters sit at the end of the path and collect the click, while the demand they "converted" was created upstream.
Because the ground-truth contribution of every channel is known (it's an input to the simulation, written out to a _ground_truth.json), we can later mark the MMM's homework. And because customer-level journeys — orders, items, refunds, and attribution touchpoints — are generated to be consistent with that aggregate process, click-based attribution (first / last / linear) can be computed from the touchpoints and will diverge from the truth exactly as designed.
One non-obvious detail matters for what comes later: the channels' daily spend series are decorrelated on purpose. Each channel has its own campaign flighting — independent weekly bursts and the occasional pause — rather than every channel riding the same seasonal curve. Collinear spend is the thing that makes a real MMM unidentifiable; giving each channel its own signal is both more realistic and what lets the model separate them downstream.
The whole thing is seeded, so every number reproduces exactly. The trailing-twelve-month total lands at £4,795,871 against a £4.8m target — not because it was asserted, but because the process was tuned until it fell out.
Part 2 — Centralising six sources into one grain
Before you can measure anything honestly, the data has to agree with itself. In most brands it doesn't. Shopify, Meta, Google, TikTok, Klaviyo and GA4 are six silos, each with its own identity resolution, its own attribution window, and its own incentive to claim credit. Add up the revenue each platform reports it drove and you'll comfortably clear 150% of actual revenue. And none of them know profit — the ad platforms see revenue, never COGS, fees, returns or shipping.
The fix is a transformation layer. Every source lands raw, then dbt refines it through staging → intermediate → marts, ending in a governed star schema with conformed dimensions — date, channel, customer, product — shared across facts. The centrepiece is a single atomic fact at order-line grain:
-- mart_sales_detail: one row per order line, every cost allocated to the line,
-- every slice dimension flattened in. Totals reconcile exactly to fct_orders.
select
    order_id, sku, customer_id, order_date,
    region, category, acquisition_channel, cohort_month,   -- slice by anything
    net_revenue, cogs, fulfilment_cost, payment_fee, refund_amount,
    net_revenue - cogs - fulfilment_cost - payment_fee - refund_amount
        as contribution_margin                              -- profit, at the line
from ...
That one table is what turns "we can't see it" into "slice it however you like." Revenue and contribution margin by region × product × channel × cohort × date, all from one grain, all reconciling to source. The blended contribution margin derives to 34% — revenue less COGS, fulfilment, fees and returns — which is the number marketing efficiency should actually be measured against, not top-line revenue.
And because a centralised layer is only worth as much as the trust in it, every build runs 118 automated tests — uniqueness and referential integrity on keys, accepted-value checks, source freshness, and custom singular tests that reconcile the marts back to raw within tolerance.
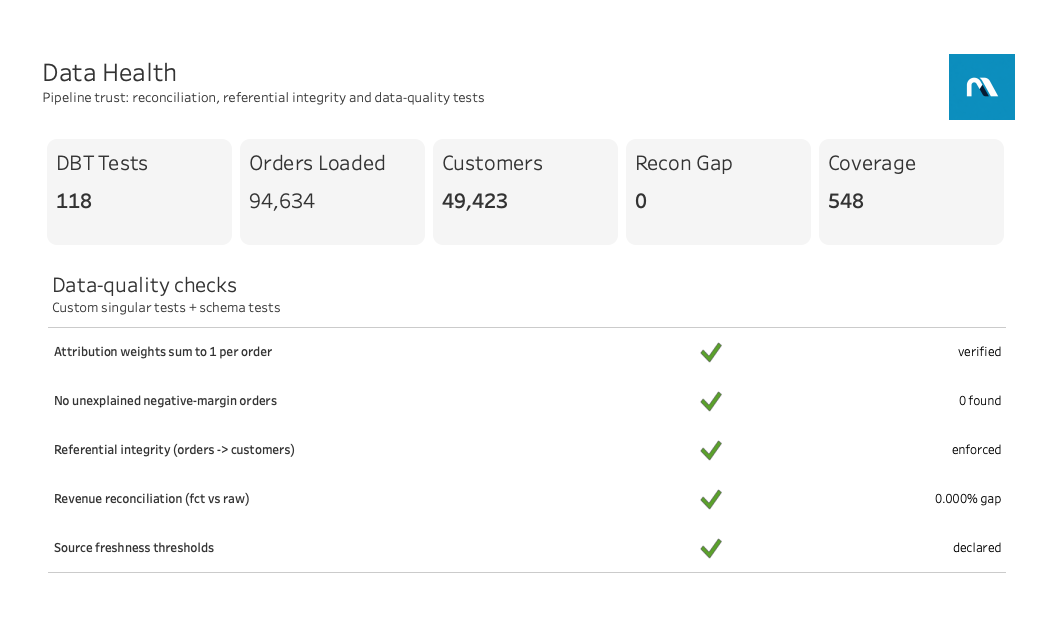
The reconciliation gap between the fact table and raw source is 0.000%. That's not a claim on a slide — it's a test that fails the build if it ever drifts past half a percent.
Part 3 — The MMM: recovering incrementality
Last-click attribution answers the wrong question. It asks "who got the final click?" and hands 100% of the credit there — which structurally over-rewards the harvesters and under-rewards the channels that fill the funnel. Optimise your budget to last-click and you defund exactly the demand creation that keeps the funnel full.
A marketing-mix model answers the right question: incrementality. It fits the same shape the data was generated from — baseline, plus each channel's adstocked, saturated effect, plus trend and seasonality — as a Bayesian model with pymc-marketing. Because we know the ground truth, we can check the recovery directly:
MMM RECOVERY vs GROUND TRUTH  (trailing-12m incremental share)
  channel               ground truth   MMM recovered   abs err
  meta_prospecting             22.0%           20.5%      1.5
  tiktok                       13.0%           13.7%      0.7
  youtube                       9.0%           10.0%      1.0
  google_nonbrand              18.0%           19.1%      1.1
  google_brand                 12.0%           12.4%      0.4
  email                        16.0%           13.6%      2.4
  Mean absolute error: 1.12 percentage points
The model recovers the planted contributions to within about one percentage point. That's the credibility check the whole exercise turns on: the MMM isn't asserting a story, it's recovering one we can verify.
Now the contrast, which is the point of the first dashboard above. Under last-click, email takes 27% of channel credit and Google Brand 24%; the MMM re-prices them to 14% and 12%. The channels last-click buries — Meta prospecting at 8%, TikTok at 4%, YouTube at 2% — the MMM lifts to roughly 22%, 14% and 10%. At the portfolio level, reported MER is 3.4× and incremental MER is 2.8×: the gap between what the platforms claim and what's actually moving the business.
And the derivation behind the headline. Reported ROAS is last-click revenue over spend; incremental ROAS is the MMM's modelled incremental revenue over the same spend:
Google Brand — spend ≈ £80k
  reported ROAS    = last-click revenue £1.17m / £80k  = 14.6×
  incremental ROAS = MMM incremental   £0.50m / £80k  =  6.3×
Same spend, two very different prices. The 14.6× is what a brand-search line item looks like when it's standing at the finish line taking credit for a race that upper-funnel channels ran. The 6.3× is what it's actually worth. The reverse holds for the channels last-click starves: YouTube reports 0.9× and is 3.8× incrementally; Meta prospecting reports 1.1× and is 2.4×. Reallocating budget from the over-credited harvesters toward the under-credited upper funnel is, for most brands, the single largest efficiency lever available — and it is invisible without this model.
Part 4 — From revenue to profit, and to a decision
Incrementality tells you which channels work. Profit economics tells you what to do about it. The same centralised layer that powers the attribution view powers the unit economics.
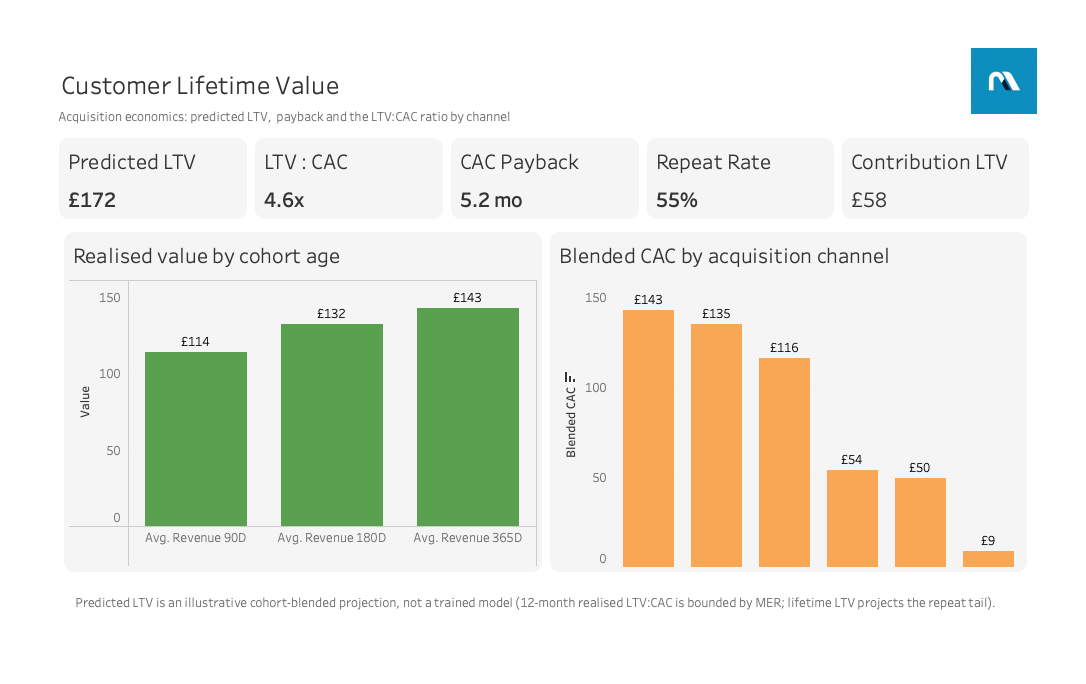
Two things worth deriving here. First, the same illusion shows up on the cost side. Blended CAC by channel puts Google Brand at about £9 and the real acquirers — YouTube, TikTok, Meta prospecting — at £116–143. Last-click makes brand search look almost free to acquire on, because it's mostly re-capturing customers you already have; the channels that genuinely bring new customers in cost an order of magnitude more, and are worth it.
Second, a constraint people rarely state out loud: a 12-month realised LTV:CAC is bounded by MER. Revenue-per-new-customer divided by spend-per-new-customer is, in aggregate, just your media efficiency ratio — so a realised 12-month LTV:CAC can't exceed ~3.4×. The 4.2× headline is a lifetime figure that projects the repeat tail beyond year one, and the dashboard labels it as an illustrative projection rather than dressing it up as a trained model. That labelling is deliberate: the discipline of the whole build is that every number is either measured from reconciled data or clearly marked as a modelled projection.
The final view stitches owned and marketplace demand into one number, so efficiency is measured across where customers actually buy, not just the owned store:
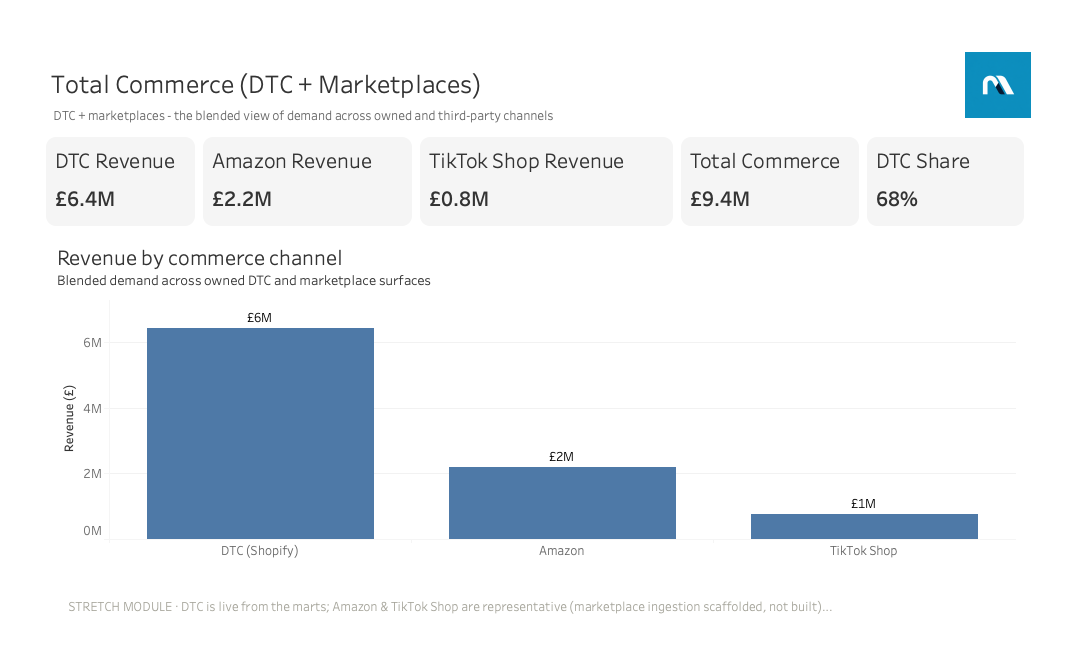
DTC here is live from the marts; the marketplace figures are flagged, on the dashboard itself, as representative placeholders — the ingestion is a scaffolded extension point, not yet built. Saying so on the page is the point. A black-box attribution tool hides its assumptions; this one prints them.
What it changes
Strip it back and the build makes one argument: the number the ad platforms hand you is not the number your business runs on. Last-click over-credits the finish line and hides the funnel; revenue-based ROAS hides profit; six disagreeing dashboards hide the truth entirely.
For a CMO, the payoff is a measurement story that survives a sceptical board — incremental ROAS and response curves you can defend, and permission to fund the upper funnel that last-click quietly defunds. For a CFO, it's marketing spend expressed as a modelled, profit-based, auditable investment: contribution margin instead of vanity revenue, incremental MER instead of platform-reported MER for planning, and CAC payback as a cash lens — all reconciled and tested, not asserted on a slide.
The whole stack runs locally on DuckDB at zero infrastructure cost and deploys to Snowflake with a profile swap, and the entire chain — data, transforms, tests, MMM, dashboards — reproduces from a single command with a fixed seed. Which is the last derivation worth stating: if you can't reproduce a number, you can't trust it. Every number here reproduces.